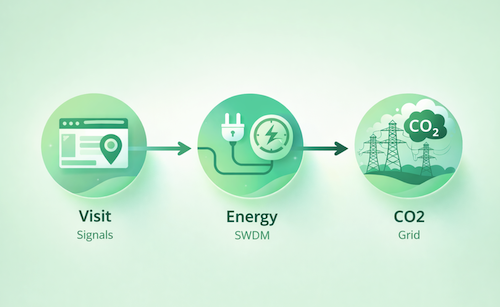
Methodology

How Webcarbon Works

We track every visit anonymously, model energy use with the Sustainable Web Design Model, and convert it to CO2 emissions using the local electricity grid intensity.

From visit to CO2

Each visit generates lightweight, anonymized interaction signals like page weight, time on page, scroll depth, and device capabilities. We never store personal data or use the visitor location for anything other than grid emissions.

Anonymous by design

No cookies, no PII, no behavioral profiling.

Real-time capture

Signals are processed instantly per visit.

Webcarbon measurement flow diagram

Energy modeling with SWDM

We use the Sustainable Web Design Model (SWDM) to estimate energy across data centers, networks, and user devices, aligned to the latest published data sources. Learn more.

Data centers

22%

Operational and embodied energy allocation.

Networks

24%

Energy used to move data.

User devices

54%

Largest share of web energy usage.

The formula behind every visit

We apply the SWDM equation to each page view, combining operational and embodied emissions across data centers, networks, and devices, then adjust for new vs returning visitors and caching behavior.

Average Emissions per Page View (gCO2e) = ([(OPDC x (1 - Green Hosting Factor) + EMDC) + (OPN + EMN) + (OPUD + EMUD)] x New Visitor Ratio) + ([(OPDC x (1 - Green Hosting Factor) + EMDC) + (OPN + EMN) + (OPUD + EMUD)] x Return Visitor Ratio x (1 - Data Cache Ratio))

OPDC

Operational emissions data centers

EMDC

Embodied emissions data centers

OPN

Operational emissions networks

EMN

Embodied emissions networks

OPUD

Operational emissions user devices

EMUD

Embodied emissions user devices

Green Hosting Factor

Portion of zero-carbon hosting (0 to 1)

New Visitor Ratio

Share of first-time visitors (0 to 1)

Return Visitor Ratio

Share of returning visitors (0 to 1)

Data Cache Ratio

Portion loaded from cache (0 to 1)

Default vs. real device mix

Example chart. Your dashboard shows actual device energy measured on-page.

Replace averages with real device data

SWDM uses global averages for device energy share. Webcarbon replaces those averages with real device metrics measured per visit, improving accuracy for mobile, desktop, and tablet audiences.

On-device metrics

Measured energy signals per device session.

Audience-specific

Reflects your real device mix, not global averages.

Convert energy to CO2 by grid

We apply the energy used per visit to the CO2 intensity of the electricity grid. Location is used only to select the appropriate grid factor and is never stored as personally identifiable data.

Grid-aware emissions

Same energy, different CO2 depending on region.

Privacy-safe location use

Only used to match a grid carbon intensity value.

Grid intensity illustration

Backend emissions, when applicable

Example breakdown across data center, network, and device segments.

Account for data center usage

When backend interactions occur, we include server-side energy and data transfer in the calculation. This ensures that dynamic pages, API calls, and heavy workflows are accurately represented in the total emissions.

Dynamic workloads

API calls and server rendering included.

End-to-end coverage

Devices, network, and data centers together.

Lightweight tracking, minimal impact

The Webcarbon tracker is intentionally small and optimized. It runs fast, avoids heavy dependencies, and minimizes network usage so it does not impact page performance.

We keep the payload compact and only send the signals required for accurate energy modeling, avoiding any unnecessary data transfer or storage.

Small script

A tiny footprint designed to be non-intrusive.

Optimized payloads

Only essential metrics, no wasted data.

Low bandwidth

Designed to reduce transfer emissions.

Performance safe

No measurable impact on load times.

See the methodology in action

Start measuring now and get a per-visit breakdown of energy and CO2 for your website.

Start Measuring